
Where Every Child is Celebrated
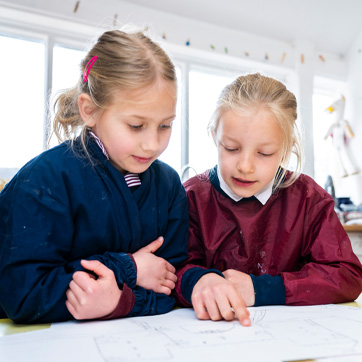
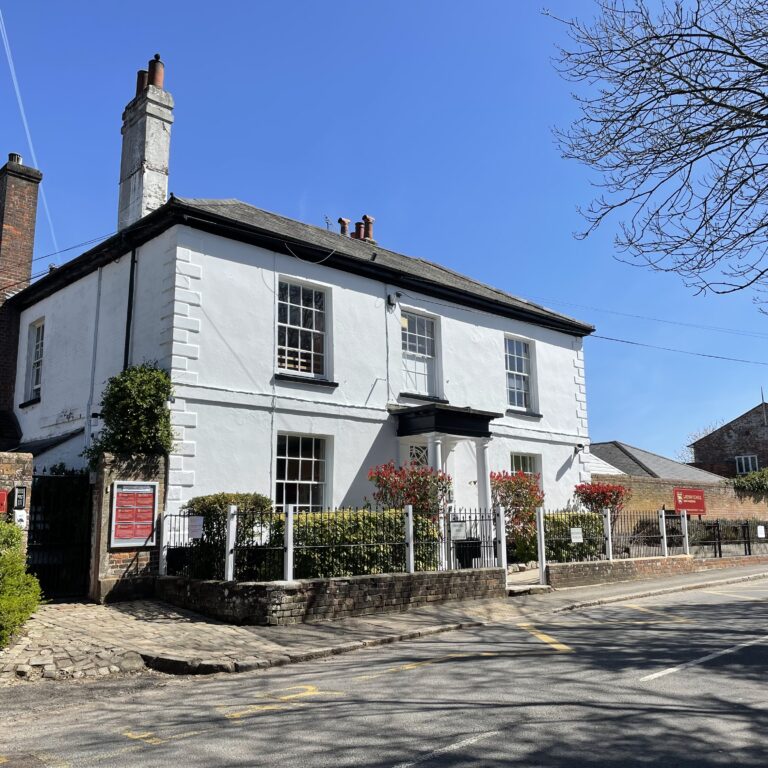
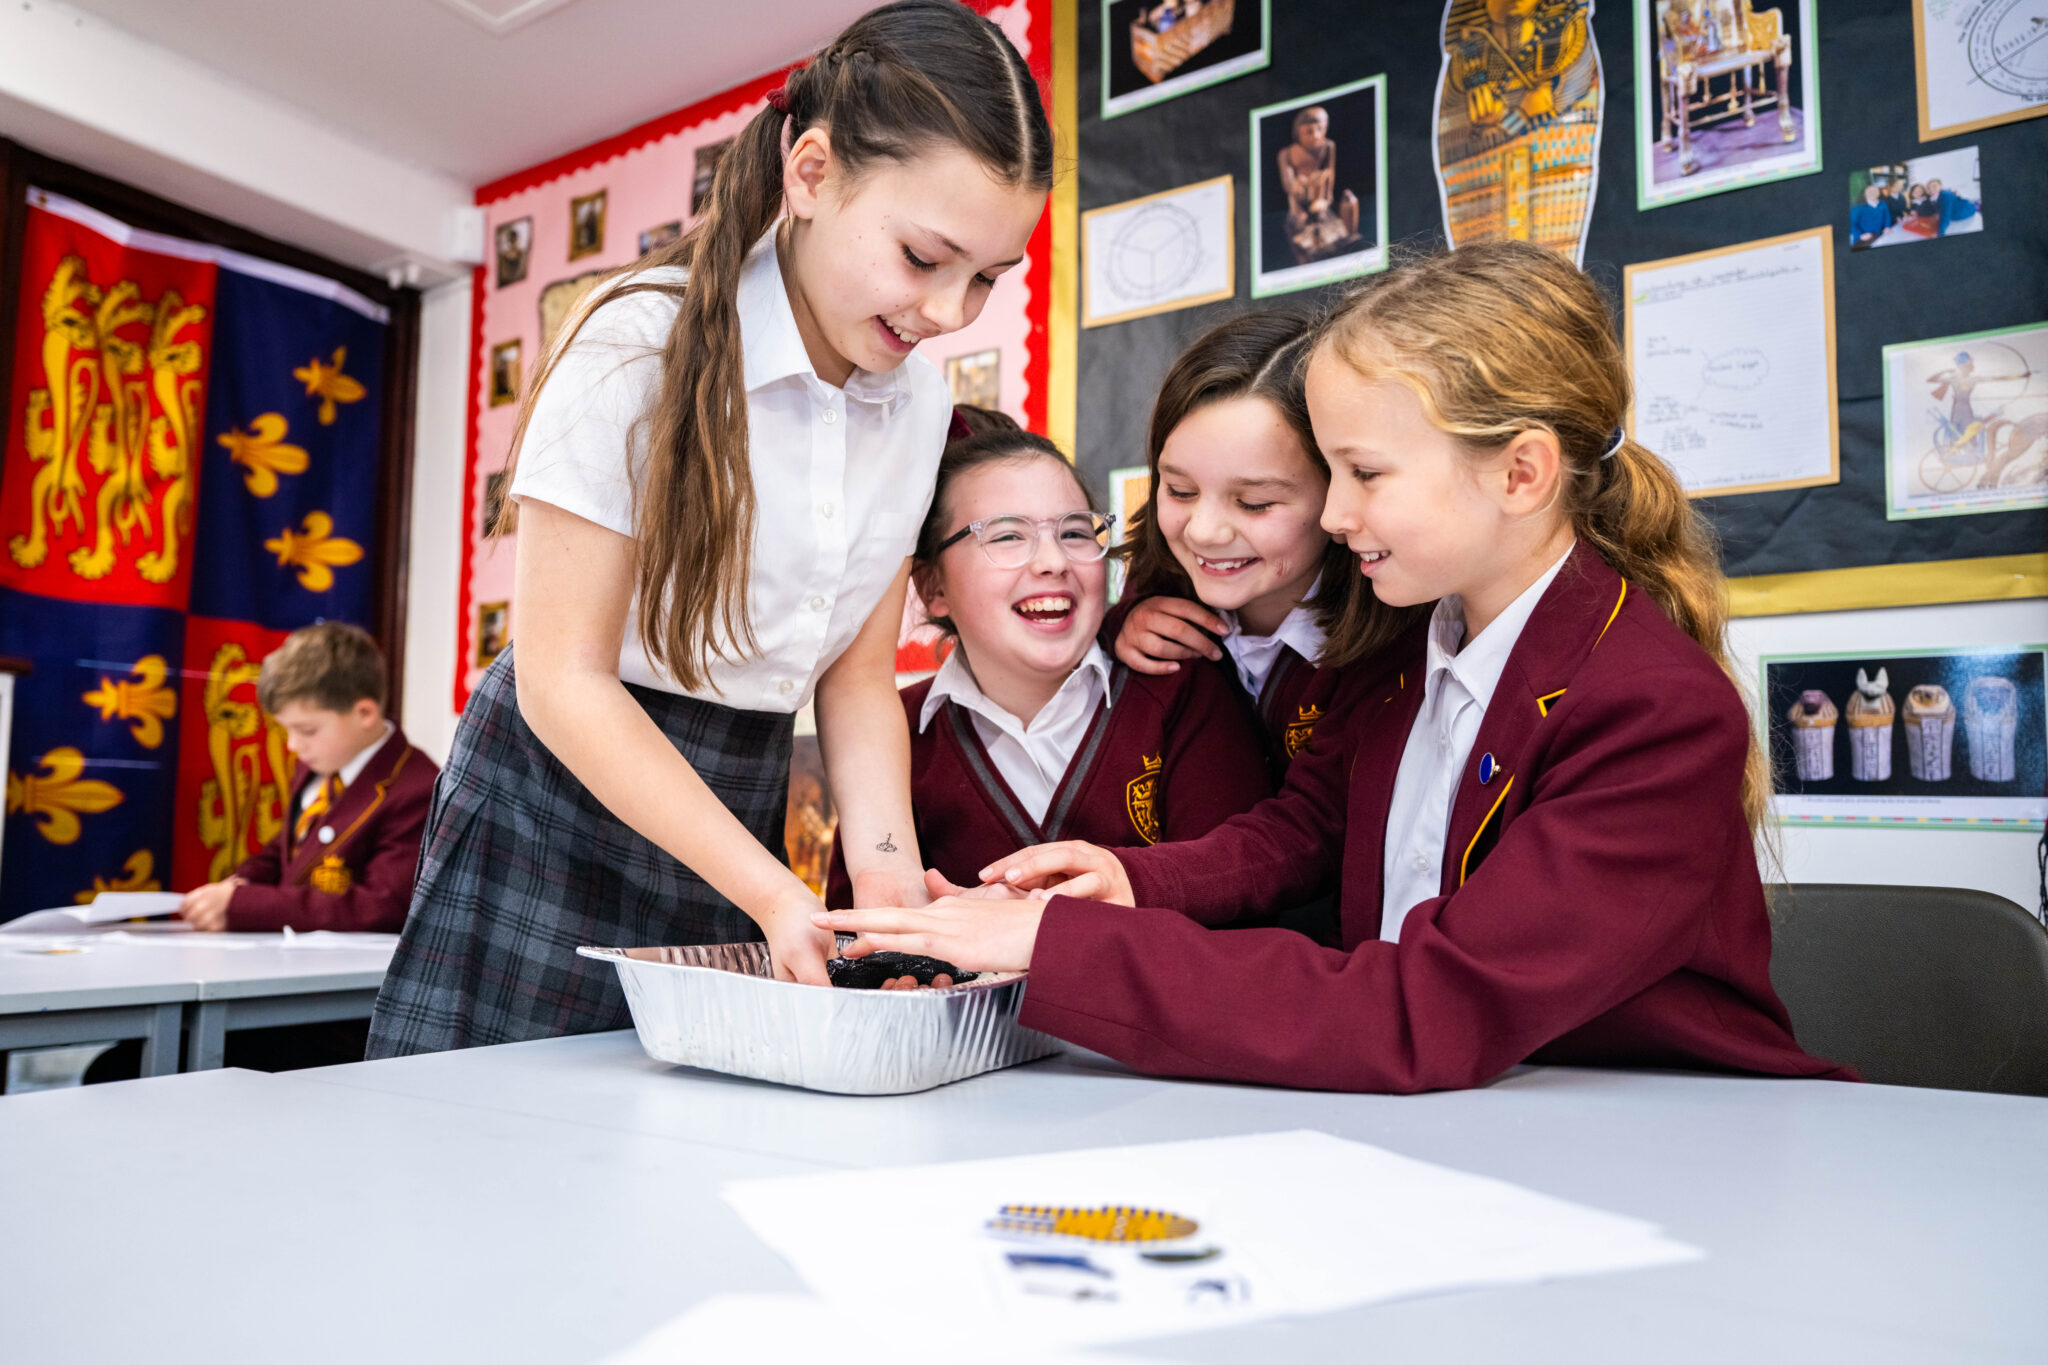
Situated in the heart of the Chiltern hills in the beautiful village of Great Missenden in Buckinghamshire, Gateway School is a co-educational, independent day school for children aged two to eleven, ISI rated ‘excellent’ in all areas. At Gateway School, education is not just about academic success; it is about building a foundation that gives each child the confidence and skills they need to be the best they can be.

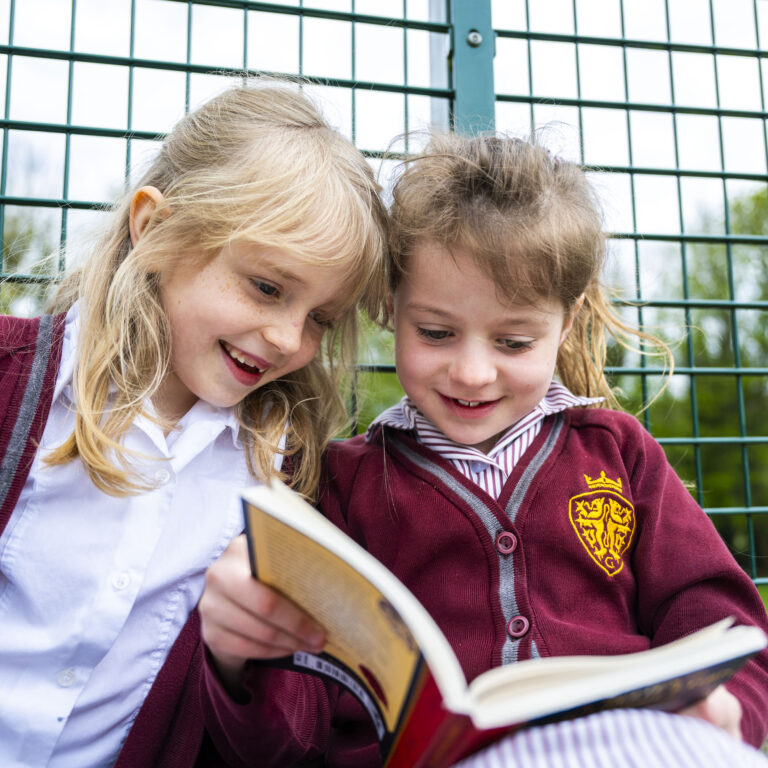
Where Happy Children Learn
A Gateway to Success

In the Heart of Everyone
We believe that a strong community connection enriches the educational experience and promotes a supportive network for children, parents, and staff alike. Our community oriented initiatives are designed to involve parents actively in the learning process and to strengthen the partnership between home and school.

Leavers' Destinations
Children at Gateway School undertake exams for the Buckinghamshire Grammar School transfer test and local Independent Schools. We are proud that the majority of pupils receive offers from their preferred senior school. This high success rate is attributed to the academic journey and the positive partnerships between parents and staff, in identifying the schools that holistically best fit the children


Our Stories

Posted: 4 May 2025
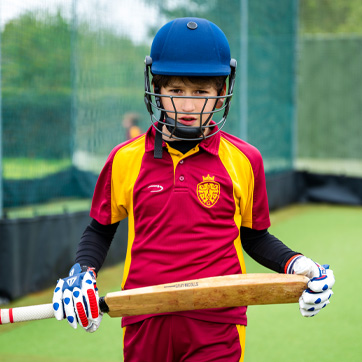
Meet Our New Director of Sport – Mr Lafleur
We’re thrilled to welcome our new Director of Sport to Gateway School- Mr Lafleur! With a background in both teaching and playing sport at a high level, he brings a wealth of experience, passion, and energy to our community. Before...
Read Article
🎉 Gateway School Open Morning- Friday 23 May🎉
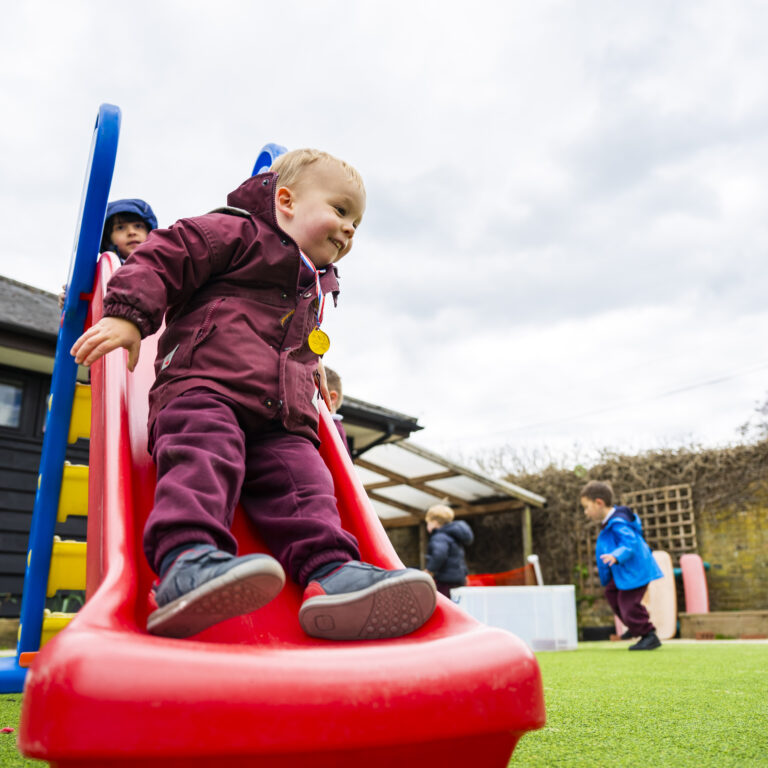
⚽️ Sports, cows 🐄, and learning galore,
🎨 Art, music, and so much more!
📚 Classrooms full of bright, curious minds,
🌳 Outdoor adventures, where learning unwinds!
🏆 Excellent results, a community so tight,
Where every child’s journey shines bright.
🗓 Friday 23 May 2025 | 09:30am
Come see why Gateway is where fun and learning meet,
A place where every child’s journey feels complete.
🎨 Book today through the link in the bio or on our website. Spaces are limited
#OpenMorning #GatewaySchool #LearnAndPlay #JoinTheAdventure #GatewayCommunity #ASPIRE #TheGatewayToYourFuture
