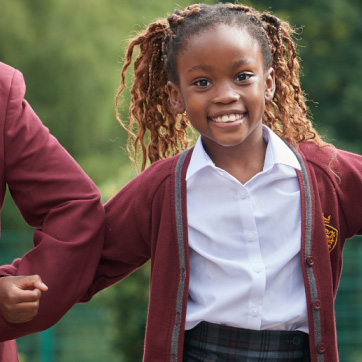
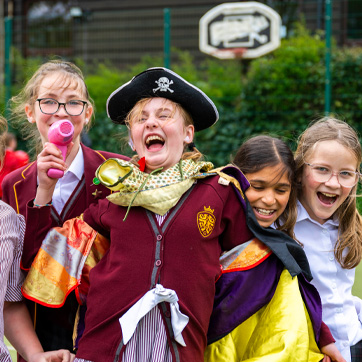
Where Every Child is Celebrated
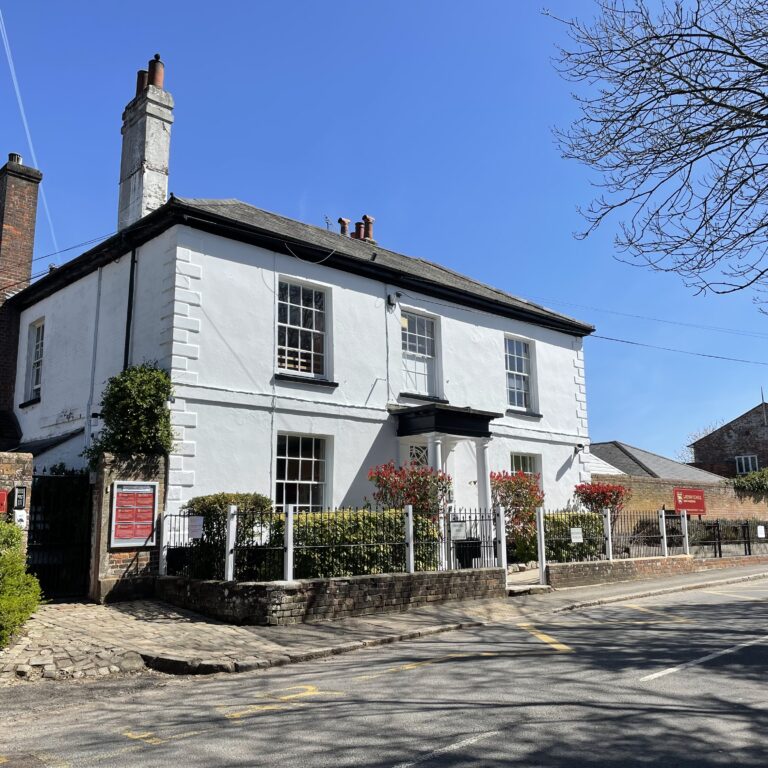
Situated in the heart of the Chiltern hills in the beautiful village of Great Missenden in Buckinghamshire, Gateway School is a co-educational, independent day school for children aged two to eleven, ISI rated ‘excellent’ in all areas. At Gateway School, education is not just about academic success; it is about building a foundation that gives each child the confidence and skills they need to be the best they can be.

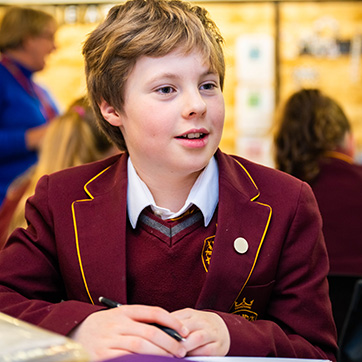
Where Happy Children Learn
A Gateway to Success
In the Heart of Everyone
We believe that a strong community connection enriches the educational experience and promotes a supportive network for children, parents, and staff alike. Our community oriented initiatives are designed to involve parents actively in the learning process and to strengthen the partnership between home and school.
Leavers' Destinations
Children at Gateway School undertake exams for the Buckinghamshire Grammar School transfer test and local Independent Schools. We are proud that the majority of pupils receive offers from their preferred senior school. This high success rate is attributed to the academic journey and the positive partnerships between parents and staff, in identifying the schools that holistically best fit the children


Our Stories
Posted: 4 May 2025
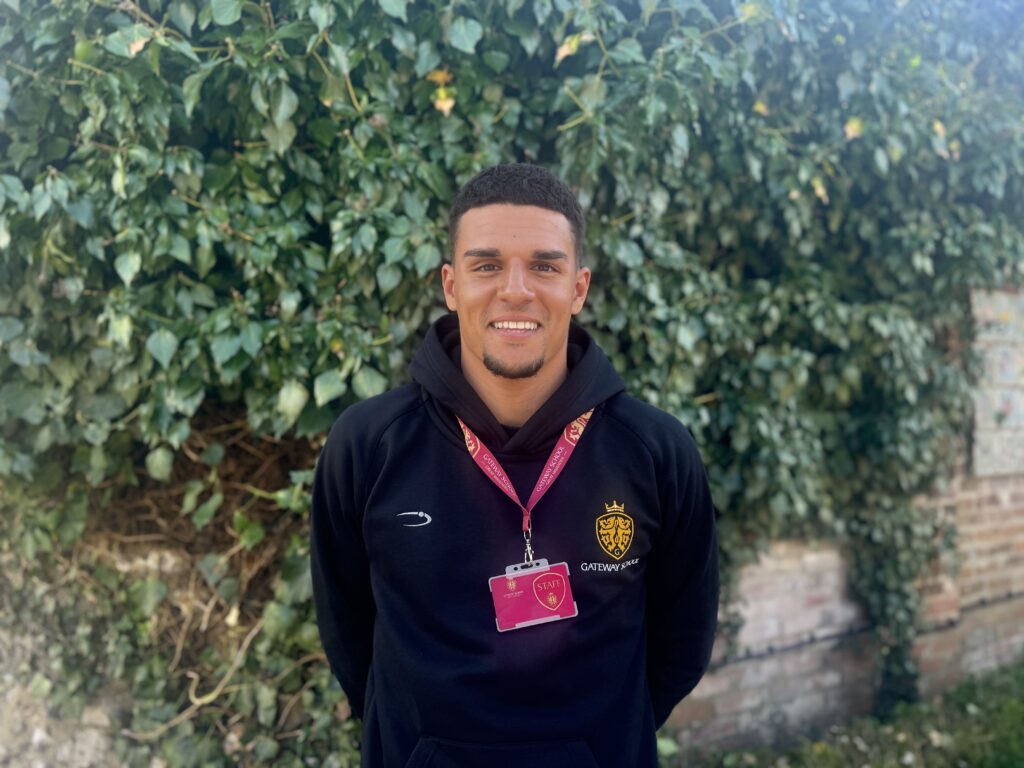
Meet Our New Director of Sport – Mr Lafleur
We’re thrilled to welcome our new Director of Sport to Gateway School- Mr Lafleur! With a background in both teaching and playing sport at a high level, he brings a wealth of experience, passion, and energy to our community. Before...
Read Article 🌟 We’re finalists! 🌟
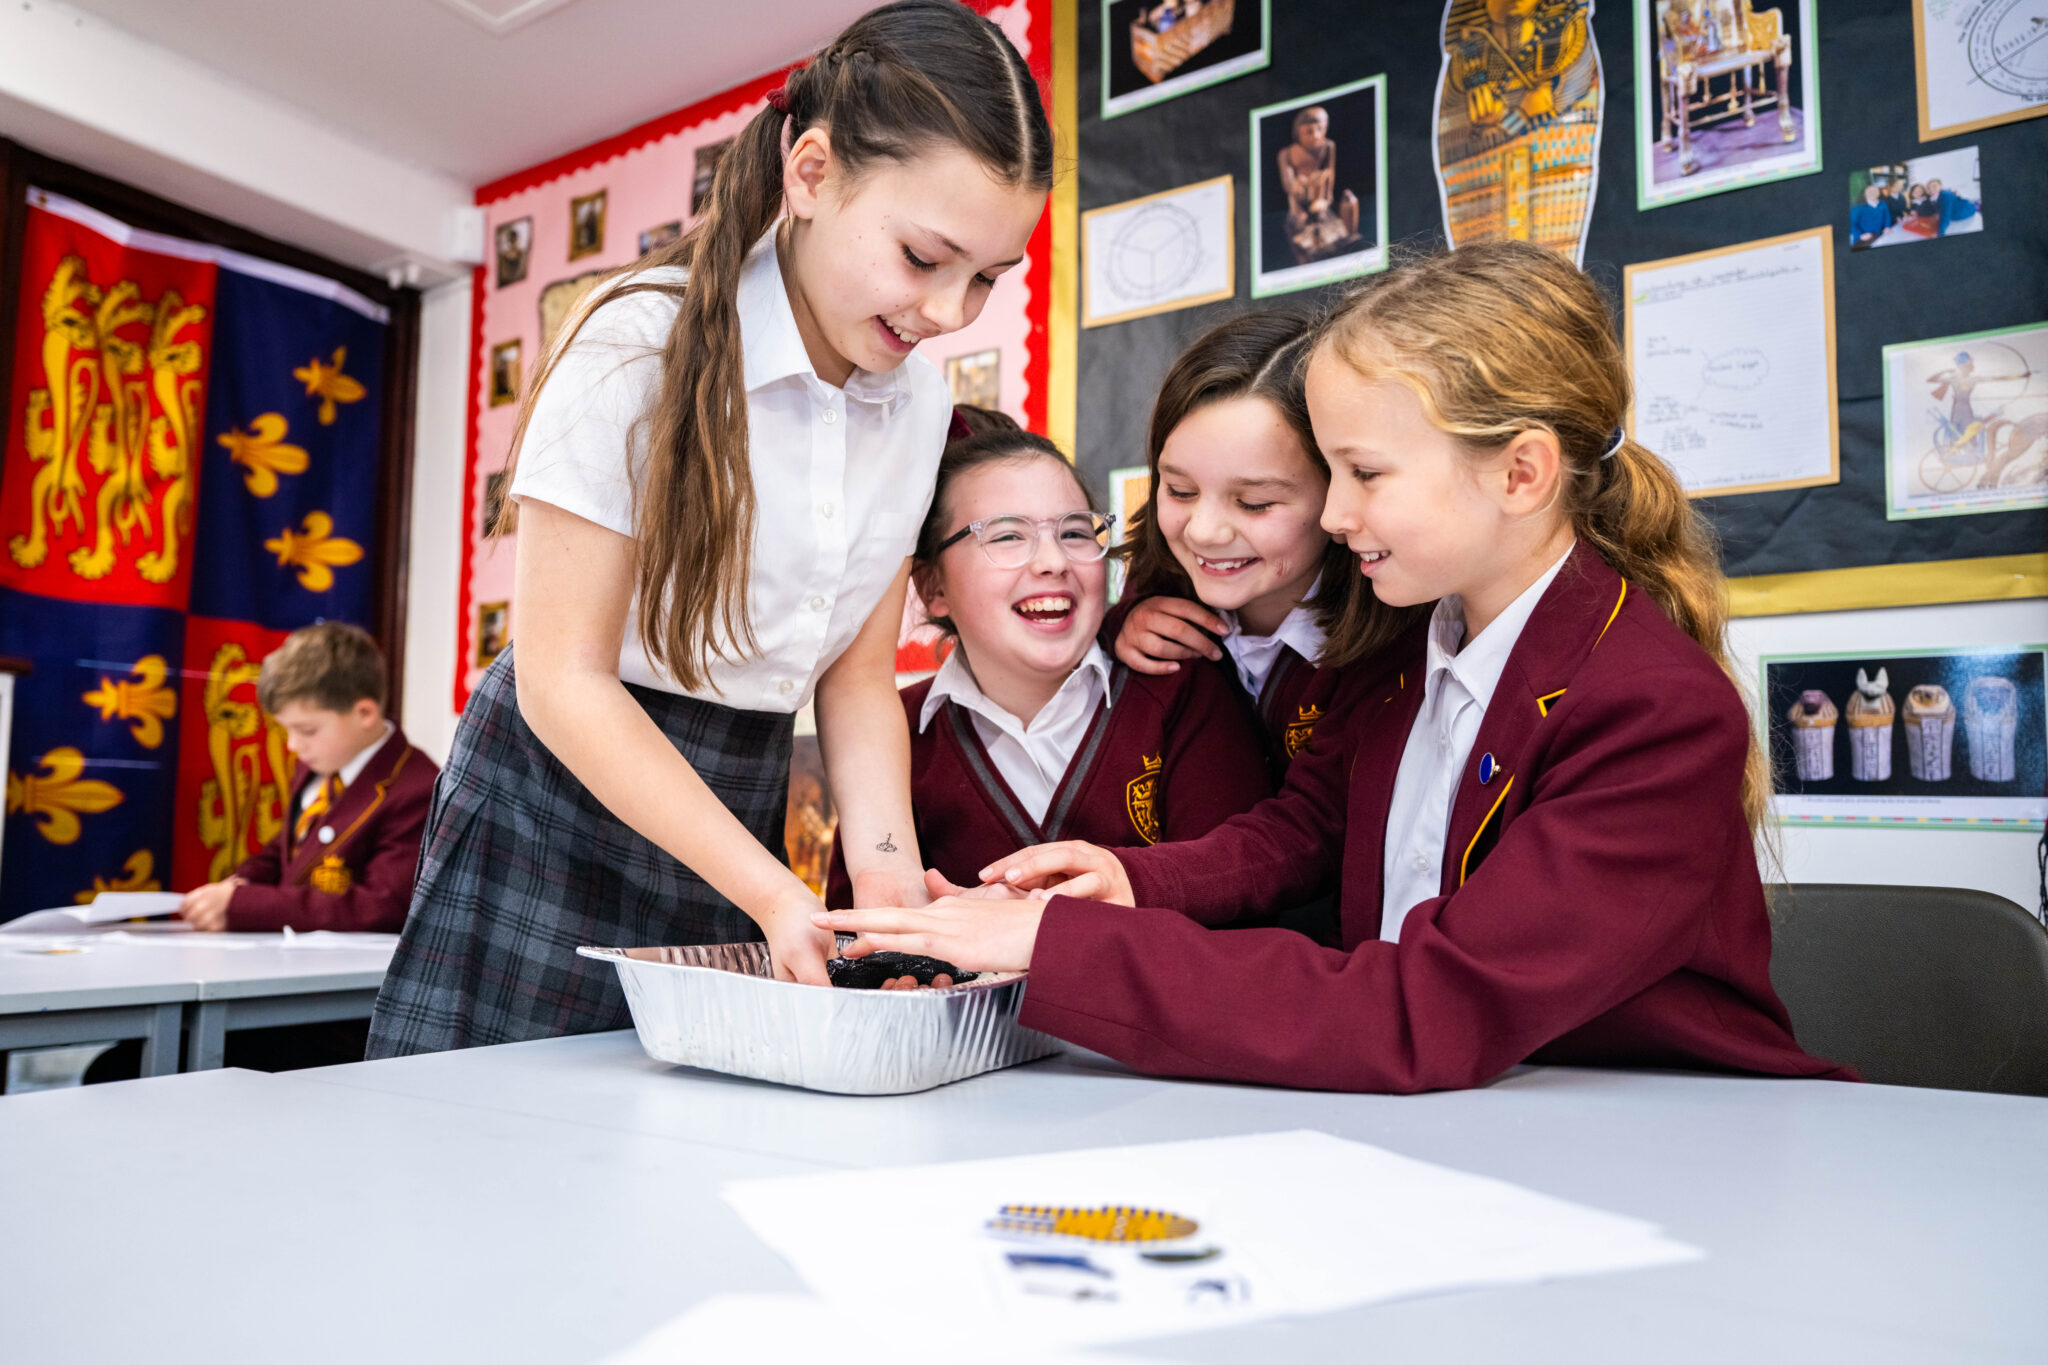
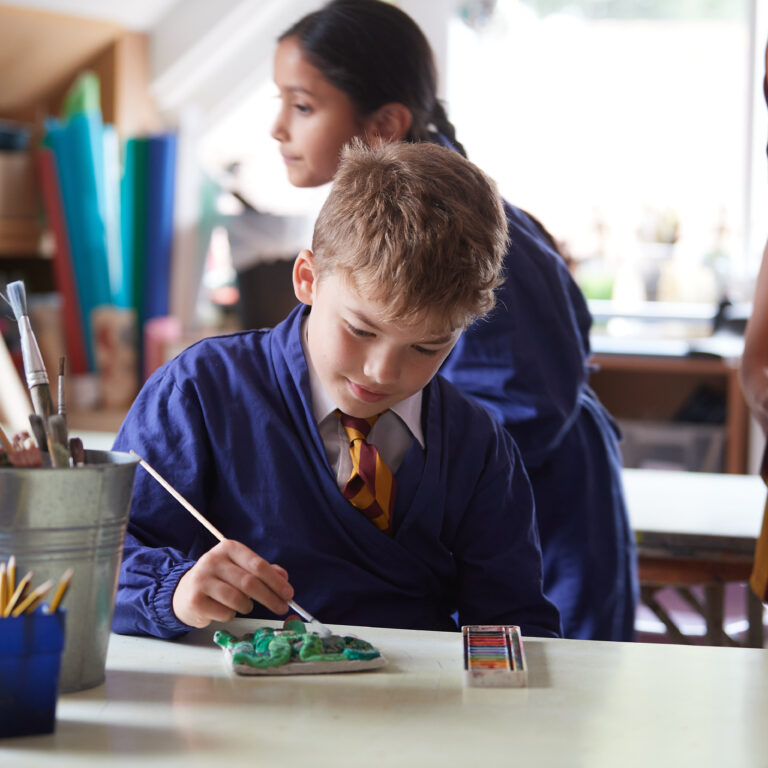
🎉 We’re thrilled to announce that Gateway School has been shortlisted in the Muddy Stilettos Best School Awards 2025, in the category Best Experiential Learning.
👏 Huge congratulations to our incredible team and to our brilliant pupils.
📢 We’ll keep you updated – but for now, we’re proud to be recognised among the very best!
#MuddyStilettosBestSchoolAwards #ExperientialLearning #GatewaySchool #ASPIRE #LearningThroughDoing #PrepSchoolExcellence #MuddyBootsBigIdeas
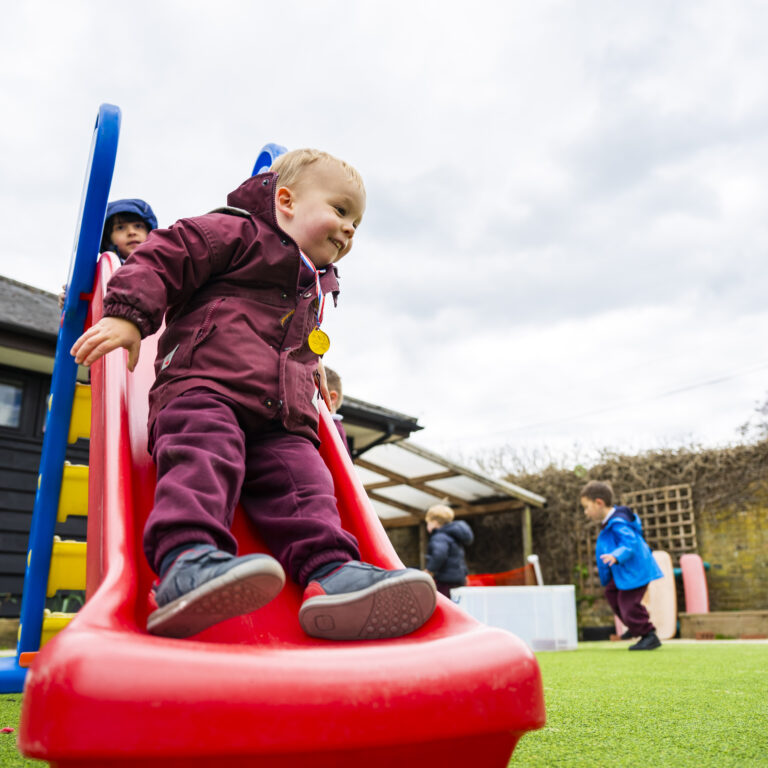
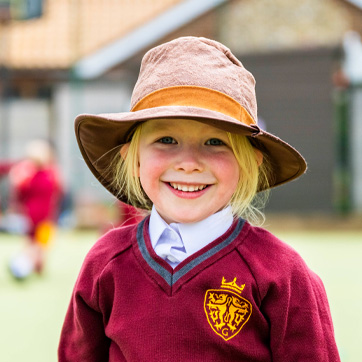
🌟 There’s something truly special about Gateway Preschool
😊 It’s hard not to smile when you see our Preschoolers waving at Year 6 in assembly, playing outside with confidence, or sitting in the library while an older pupil reads them a story.
🏫 From the age of 2, they’re part of our school, not just in name, but in every sense.
🧸 They have their own dedicated space and routine, but they’re also part of the heartbeat of Gateway: seen, included, and inspired by the older children around them.
📚 It’s those small but powerful moments - a story shared, a hello in the corridor, a quiet moment of pride watching them explore the playground, that show how lucky we are to grow together as one community.
🌱 Here’s to the littlest ones with the biggest futures,
🌟 And to the older pupils who lead with kindness every day.
👋 We’re looking forward to welcoming new children to our Preschool this September, and to watching our Pre-Reception children take flight as they move confidently into Reception.
#GatewayPreschool #PartOfSomethingBigger #FromAge2 #ProudToBeGateway #GatewaySchoolBucks #ASPIRE

0 CommentsComment on Facebook